Analytics & Intelligence
HelpmApp transforms raw engagement data into actionable intelligence for your organization. Understanding your impact is the first step toward optimization.
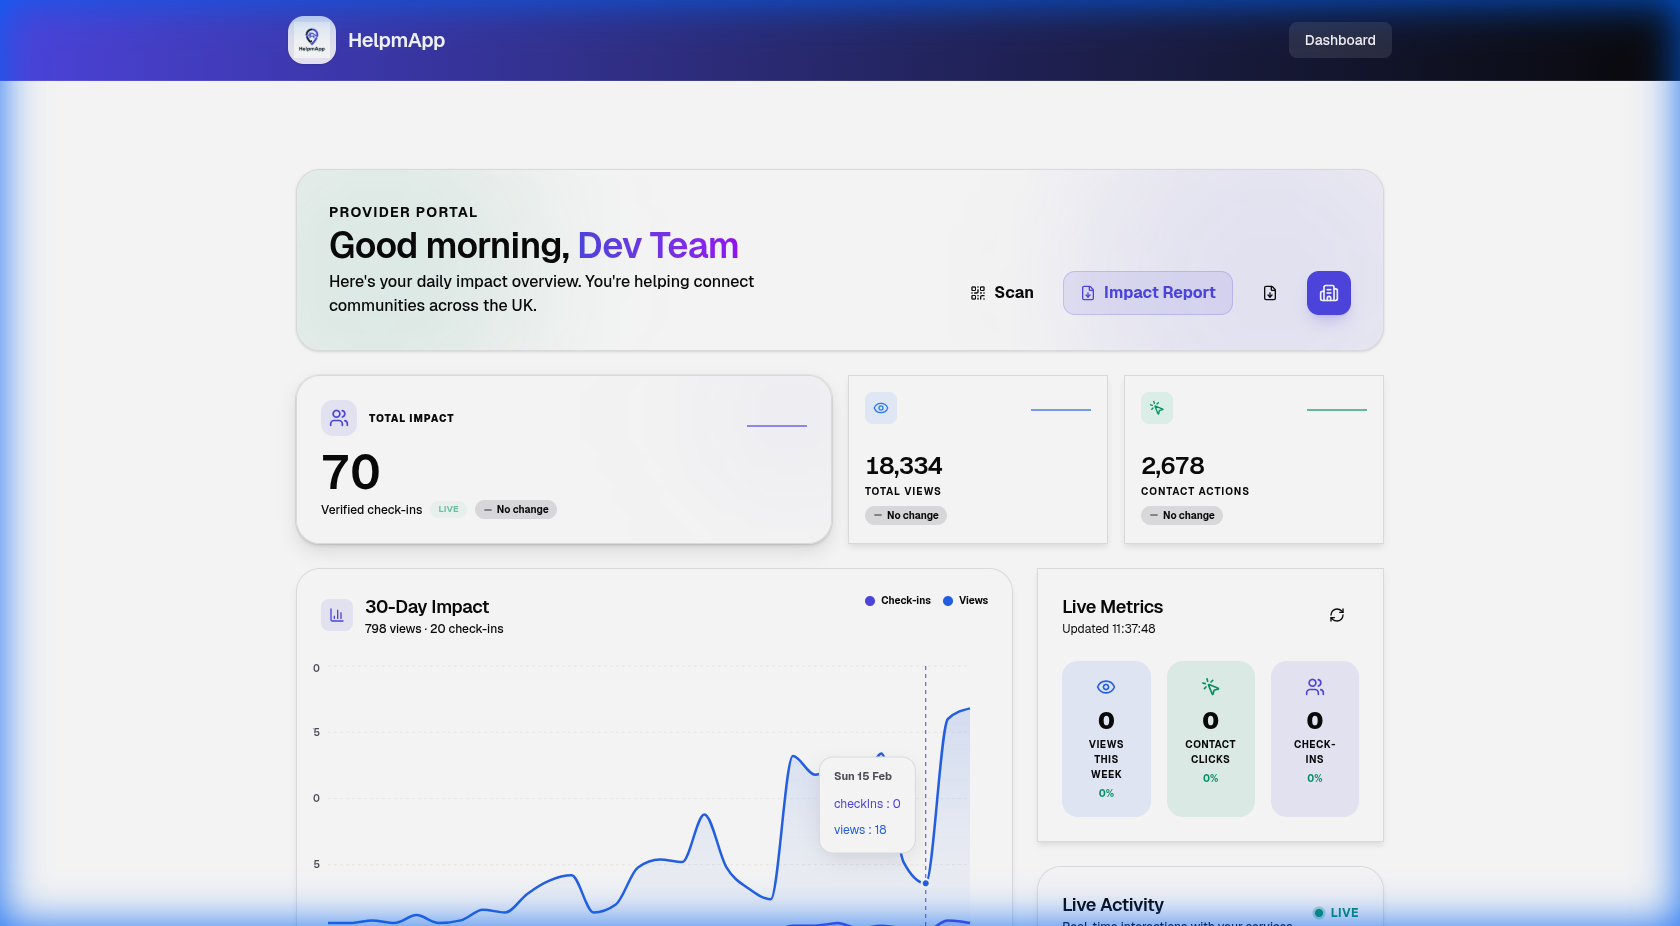
Core Metrics
We track three primary indicators of service performance:
- Impressions: How many times your service profile was viewed by a user.
- Interactions: Clicks on your phone number, email, or website (intent to contact).
- Check-ins: Validated user visits to your location via QR or geofence.
Strategic Insights
Conversion Funnel
Visualize the user journey from initial discovery to validated visit. Our dashboard calculates the conversion rate to help you understand if your service details effectively guide users to your door.
Peak Engagement Hours
Our 7x24 matrix analyzes when users are most active with your listings. This data helps you optimize staffing and ensure support is available when demand is highest.
Gap Analysis
Contrasts official MHCLG rough sleeping data with platform service density. This allows you to identify "Service Deserts" where your organization's expansion could have the highest social impact.
Impact Reports
Generate grant-ready professional reports in PDF format directly from your dashboard. These reports include:
- High-level KPI summaries.
- Monthly performance narratives.
- Comparative benchmarking against peer services in your category.
Mobile Access
Manage your services on the go. The unified provider navigation ensures you have instant access to your Dashboard and Team management from any mobile device. (See Project Roadmap for upcoming features).
NOTE
Privacy First: All analytics are strictly aggregated and anonymized. We never share individual user data with providers.